
What we bought, and what we checked
We bought ferulic acid from a commercial supplier. Before it went anywhere near a product, we wanted to know what was in the bag.
The instrument separates a mixture into its parts and shines ultraviolet light through each one as it passes. Different substances absorb different wavelengths, so you pick a setting that suits what you are looking for. Ferulic acid absorbs strongly at 320 nanometres, so that is where we measured.
Alongside the samples we injected a blank: the liquid we dissolve everything in, with no ferulic acid in it at all. It is the control. If the blank is flat, whatever you see in the sample came from the sample.
The solvent looked like the sample
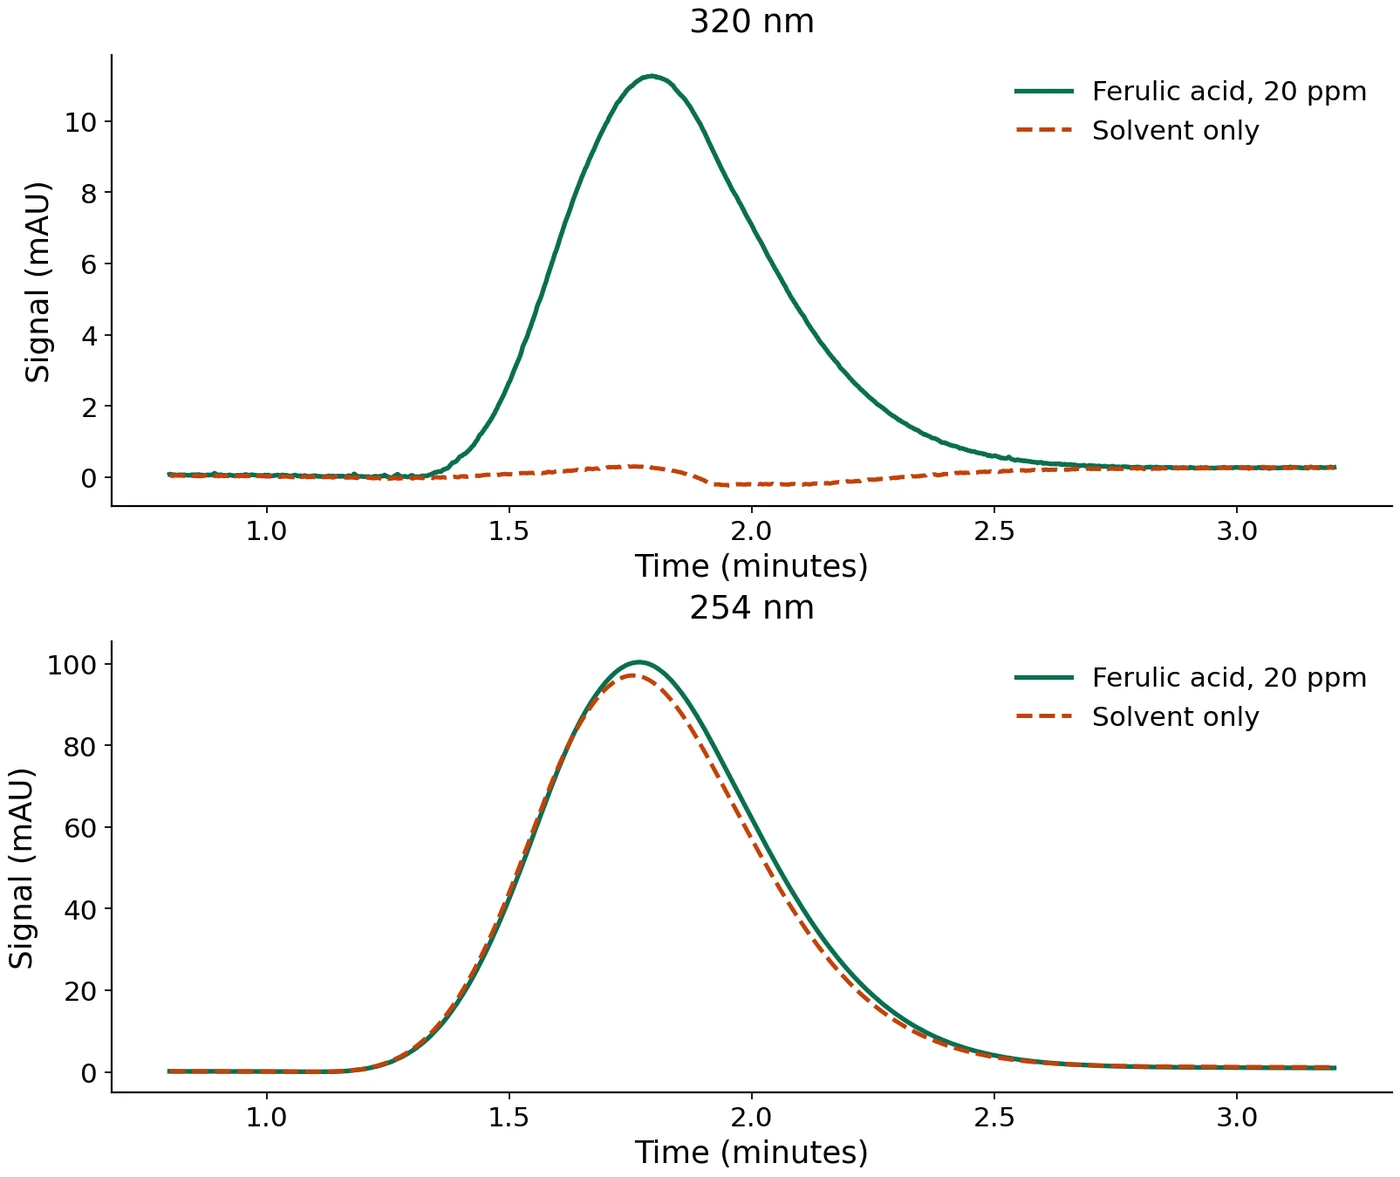
- At 320 nanometres the blank contributes 0.3 % of what we measured. That is what a control should look like, and it is the setting our actual measurements were made at.
- At 254 nanometres the blank contributes 96.0 %. Roughly four per cent of what looks like our sample is our sample.
- The two come off the instrument four hundredths of a minute apart, far too close to separate. They are integrated as one peak.
- Nothing in the sample line looks wrong. It is clean, well shaped, correctly timed and repeatable to two parts in a thousand. You would only ever know by running the empty solvent beside it.
The chromatogram cannot tell you whether you are looking at your material or at your solvent bottle. Only the blank can.
Why that is dangerous, not just odd
It matters because of what normally happens next. When a lab stops asking how much of the ingredient is in here and starts asking what else is in here, it moves to a lower setting. Lower settings pick up a wider range of substances, so you see more. That step is completely routine.
Do it without a blank and you produce a detailed impurity report on your own solvent, with excellent statistics, in complete good faith. Every number on it would look right.
A setting that works for measuring how much is there is not automatically a setting that works for finding out what else is there. Changing it is changing the method, and the control has to be run again.
Where it comes from
We did not identify the interfering substance, and we would rather say so than guess. What we could do was narrow it.
- It is not the methanol. We had injected pure methanol before anything else that day. It was clean — 206 units of response against 55,110 for the full solvent mixture, and no peak at the retention time in question.
- It is retained on the column, so it is a real compound rather than a pressure artefact from the injection itself.
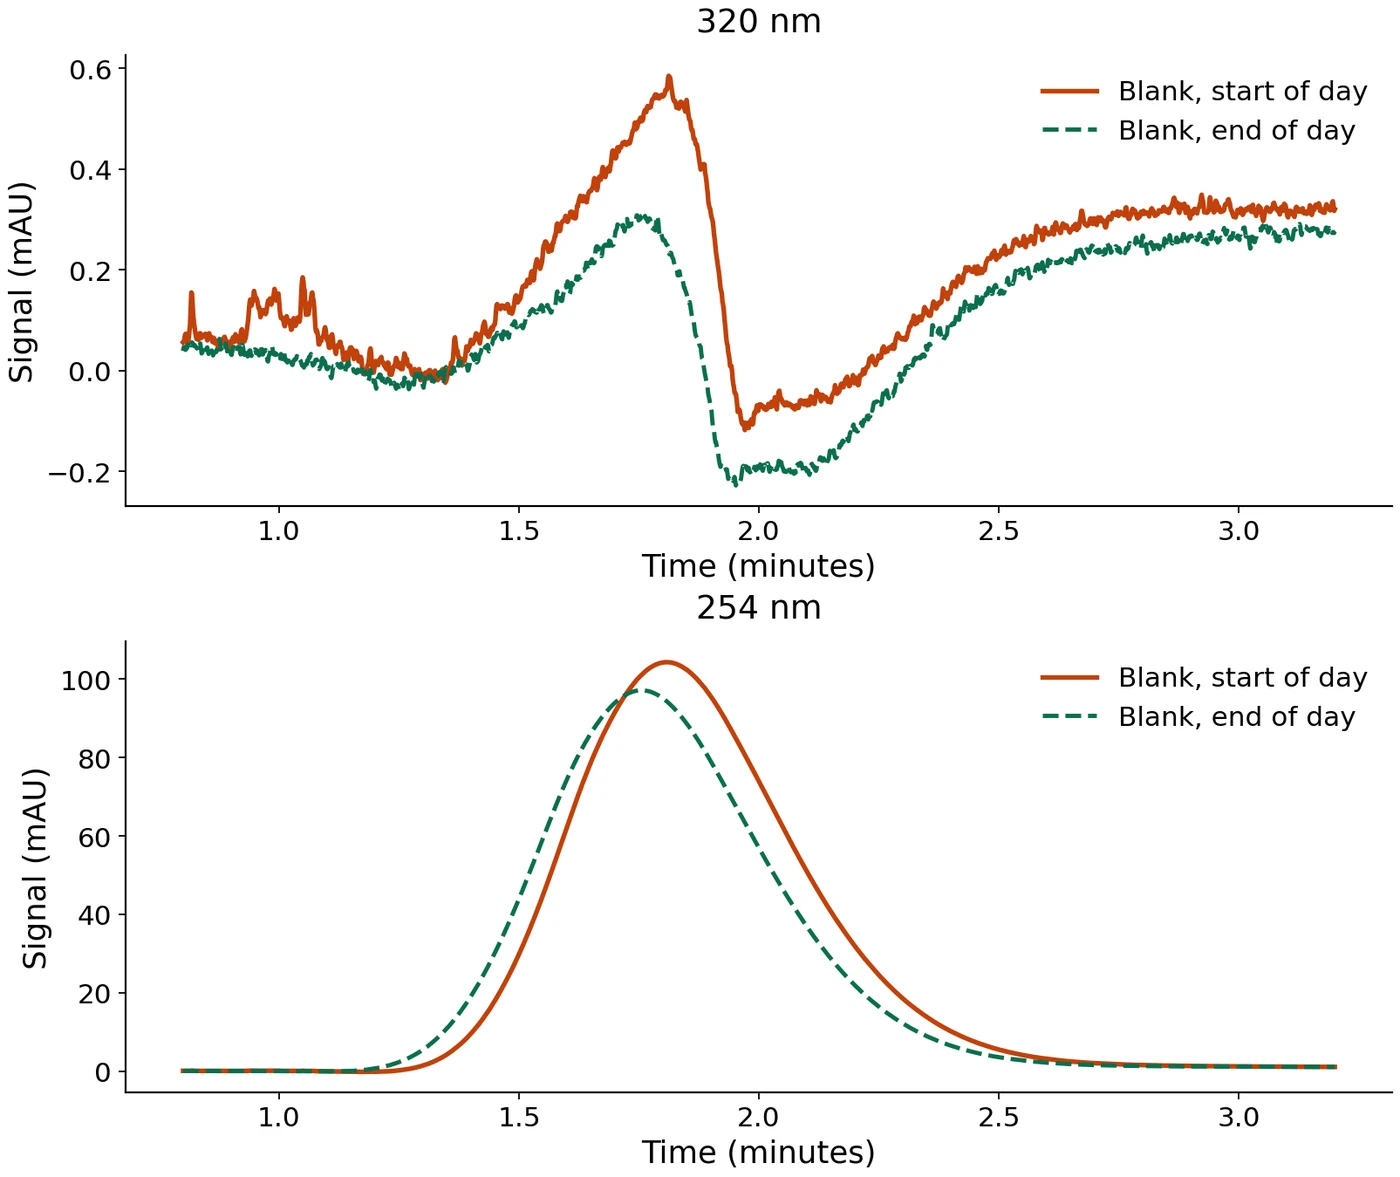
- It fades. We injected the blank twice, morning and evening. The two differ by 7 % at 254 nanometres and by a factor of eleven at 320. One blank does not describe it.
- What is left is the water, the acid, the glassware, or the filter we push the solvent through. We ran out of that batch before we could test further — which is its own lesson about running your checks while the bottle is still on the bench.
We measured the material against itself
Now the less dramatic part, and the one that bothers us more.
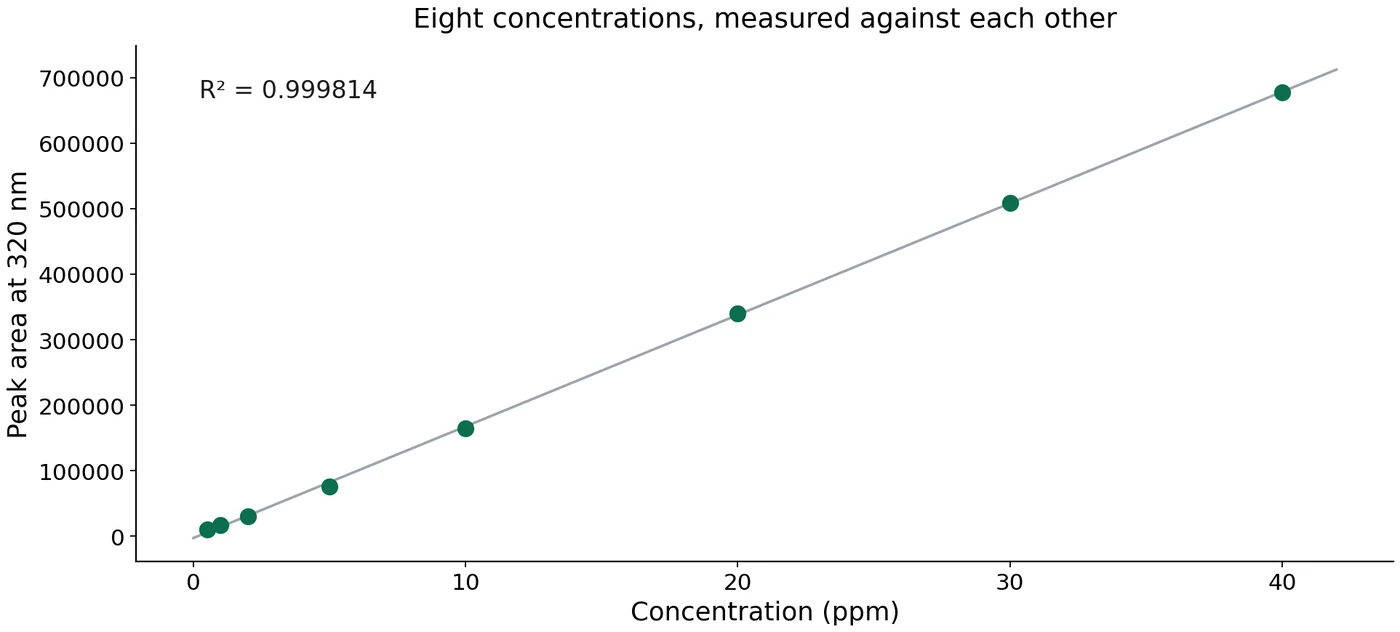
Our technique is precise to about two parts in a thousand. And it proves nothing about what is in the bag, because every one of those eight solutions came from the same bag. The material is on both sides of the comparison.
If the supplier had sent a closely related compound instead — one that looks nearly identical to this instrument, and several do — we would have obtained the same line and been just as satisfied with it.
A beautiful calibration proves your technique is good. It says nothing at all about what you are holding.
To verify what you have, you need a reference sample of known identity from an independent source. For medicines, official rulebooks require those to exist, so a market for them exists. For cosmetic ingredients it is uneven — and where a reference exists for the ingredient itself, there is usually nothing available for the impurities you would want to measure against it. You can end up fully traceable for how much is there and entirely untraceable for what else is.
What our method could not have seen
One more limitation, stated rather than buried. The sharper a chromatographic peak, the less can hide inside it. Ours gets blunter as concentration rises — worst at exactly the concentration we quantify at.
So we cannot rule out that something is sitting underneath the main peak. We are not saying something is. We are saying our method would not have found it, and a purity figure from a method in that state is bounded by the method rather than by the sample.
What we are and are not claiming
We want to be exact about the limits of what we know, because the temptation here is to say more than the evidence allows.
- We are not saying this material is impure. Nothing here shows that. Our actual measurements were made at 320 nanometres, where the interference contributes 0.3 %.
- We are not saying it is pure either. Without an independent reference sample, and with a peak too broad to see inside, the honest position is that identity is consistent with the label rather than confirmed.
- We are not naming the supplier. We have no analytical case against them. What we found is about our solvent and our method, not about their material.
- We are saying the clean numbers were doing less work than they looked like they were. A result precise to two parts in a thousand still needs a control beside it before it means anything.
The useful finding is not that our solvent was dirty. It is that nothing in a well-formed, reproducible chromatogram tells you whether you are measuring your sample or your bottle.
The paper
When the blank is the sample: a case study in diluent interference and self-referential calibration in cosmetic raw-material quality control
- Author
- Kalpesh Upadhyay, Raupyam Labs Limited
- ORCID
- 0009-0002-1619-9002
- Posted
- 19 September 2026
- Status
- Submitted for peer review · under consideration
A link to the full preprint will appear here once the record is live.
Revisions
- 2026-09-19Preprint posted and manuscript submitted for peer review. Summary published here. No reviewer comments received yet.
This page stays open. Review outcomes and corrections are added here rather than quietly edited in.
Corrections and contributions
If you have met this interference yourself, or can suggest what a retained species absorbing below 280 nanometres in an acidified aqueous–methanol diluent is likely to be, we would like to hear from you. If anything on this page is wrong, tell us and we will correct it in place, with the correction noted and dated.
care@raupyam.com · +91 74001 44899
Raupyam Labs Limited. This page describes raw-material characterisation and makes no claims regarding any finished product or any named supplier. Every figure was plotted directly from the instrument’s own exported data; none has been edited. This work has not been peer reviewed.