
Nobody sells you a pure ingredient
Every raw material that arrives at a formulation lab is mostly the thing you ordered and partly something else. That is not a scandal. It is chemistry.
What matters is which something else. A material that is 98% pure with 2% of an inert isomer is fine. A material that is 98% pure with 2% of a sensitiser is a problem you have already shipped to your customers. Both carry the same number on the certificate.
The percentage tells you how much of the drum is not what you ordered. It does not tell you what the remainder is.
We are working through our own raw materials one at a time and publishing what we find. This is the first. It is also unfinished, and we are publishing it unfinished on purpose.
Ferulic acid is 4-hydroxy-3-methoxycinnamic acid. In plants it is a structural molecule, bound into cell walls. In skincare it is an antioxidant, used widely after work at Duke University showed that adding it to a vitamin C and vitamin E serum improved the stability of the whole system. Typical use levels are low, around 0.5%. That matters here: at 0.5% in a formula, a 2% impurity in the raw material reaches skin at 0.01%. Whether that is negligible depends entirely on what the impurity is.
How ferulic acid is actually made
There are two commercial routes, and they leave behind completely different things.
Synthesis from vanillin
The dominant industrial route is a Knoevenagel–Doebner condensation: vanillin is reacted with malonic acid, usually in pyridine with piperidine as catalyst. Cheap, scalable, and the source of most material on the market.
Extraction from bran
Ferulic acid occurs naturally in rice bran and wheat bran, esterified into the arabinoxylan of the cell wall. Alkaline hydrolysis releases it. Slower, more expensive, and generally what “natural ferulic acid” refers to.
Principle
A certificate of analysis rarely tells you which route was used. The impurity profile does.
What each route leaves behind
From the synthetic route:
Unreacted vanillin
The starting material. Vanillin is a documented contact allergen, associated with allergic contact dermatitis in individuals sensitised to related materials. It is the impurity we care about most, because it is the one with a plausible route to a skin reaction rather than merely a loss of potency.
Pyridine and piperidine residues
The reaction solvent and catalyst. Both are toxic, both are controlled as residual solvents, and pyridine has a distinctive fish-like odour detectable at very low levels. A ferulic acid that smells wrong is telling you something.
From the extraction route:
Other hydroxycinnamic acids
p-Coumaric, caffeic and sinapic acids sit alongside ferulic acid in plant cell walls and come out with it. Close chemical cousins, several of them antioxidants in their own right. Low safety concern. They do mean you are getting less ferulic acid than the label suggests.
From either route, and from storage:
cis-ferulic acid
Ferulic acid is sold as the trans isomer. Ultraviolet light converts it to cis, which is less active. A potency issue rather than a safety one — but it is also the impurity most likely to be created after the material leaves the supplier, in a clear bottle on a warm shelf.
Isoferulic acid
A positional isomer, with the hydroxyl and methoxy groups swapped. Same molecular weight, very similar ultraviolet spectrum, and genuinely difficult to separate. If you are not looking for it specifically, you will count it as ferulic acid.

Ranking them by what they do to skin
We sort quality-control tests by how much harm the thing being tested for could do to skin, not by how easy the test is or by what a pharmacopoeial monograph happens to list. Applied here:
Critical — can affect skin
- Vanillin content — sensitisation potential
- Residual pyridine and piperidine — toxic solvents
- Heavy metals — catalyst and process residues
- Microbial limits
Standard — affects what the customer paid for
- trans/cis ratio — potency
- Isoferulic acid — identity and potency
- Other hydroxycinnamic acids — potency
- Water content — everything above is calculated on dry weight
Principle
This ranking is the useful output of the whole exercise. It tells you which two or three tests actually matter when you can only afford two or three.
How you would test for it
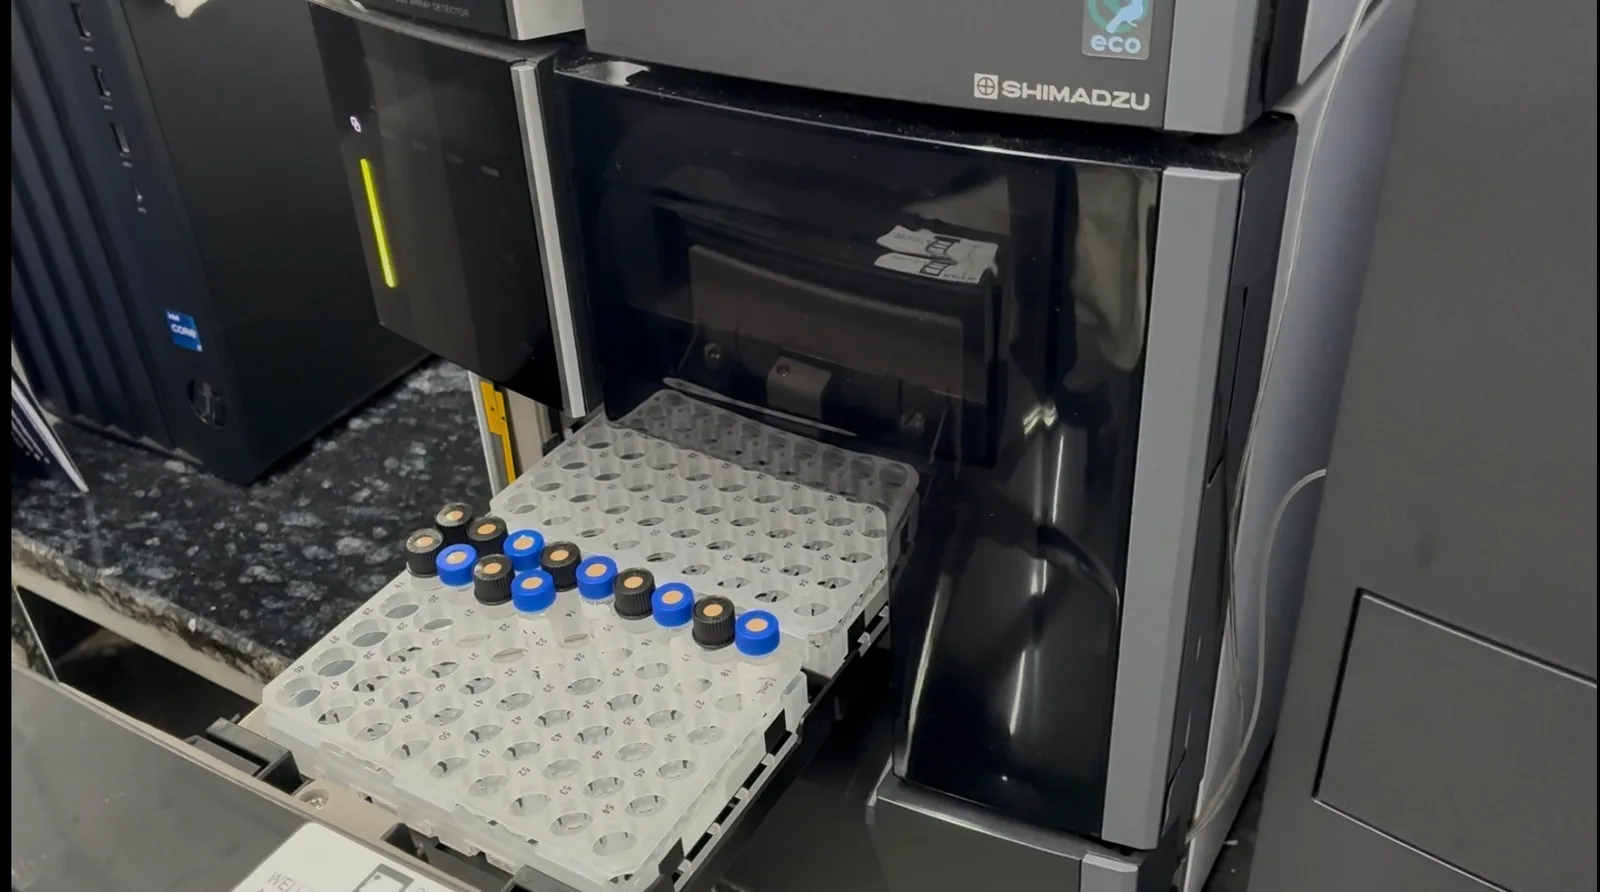
Ferulic acid absorbs ultraviolet light strongly, with a maximum around 322 nm. That makes liquid chromatography with a photodiode array detector the natural approach: separate the components, and record the full ultraviolet spectrum of each one as it comes off the column.
The spectrum is what makes it powerful. That 322 nm band is a signature, produced by the conjugated system running from the phenol ring, through the double bond, to the carboxylic acid. Vanillin has no such extended conjugation and absorbs in a visibly different pattern. A peak’s spectrum tells you something about what it is before you have done any other work.
What we found in ours
Our ferulic acid comes from a commercial supplier. We are not naming them, for a reason worth stating: until the work is finished, a name attached to an incomplete result is unfair to them and useless to you. If we find something that matters, we will say so plainly, and give them the chance to respond first.
It is ferulic acid.
The main peak shows an absorption maximum at 322 nm with a second band at 234 nm, the signature of the trans-cinnamoyl system. Retention is consistent across injections. Nothing else in the vial could produce that spectrum; our solvent is transparent in that region and shows nothing at all.
The response is proportional.
Across the range we tested, peak area rises in step with concentration. That is the basic requirement for any quantitative method, and the material passes it.
The calibration line does not pass through zero.
It should. Ours misses the origin by enough to matter at the low end. We do not yet know whether that points at the material, at how we prepared our standards, or at how the software draws a baseline under a peak that is broader than it ought to be. Three possible causes, no conclusion yet.
There is something else in there.
The software flags a second component eluting just before the main peak. We have not identified it. Given the manufacturing route, vanillin is the first candidate, and the way to check is to pull that peak’s ultraviolet spectrum and compare it against a vanillin reference.
We cannot tell you the purity.
Two reasons, both worth stating plainly.
The first is that an assay figure — this material is 99.1% ferulic acid — requires a reference standard of known potency. We do not have one yet. Without it you can measure relative response all day and never convert it into an absolute number.
The second is subtler and more important. Our current method holds a fixed solvent strength for a short run. Anything substantially greasier than ferulic acid would still be sitting on the column when the run ends, and we would never see it. Reporting a purity figure from that method would mean reporting on the fraction of the sample we happened to look at. The fix is a scouting gradient, and that run is next.
A purity figure calculated from a method that cannot see the whole sample is not a conservative estimate. It is a wrong one.
Why the method is not published yet
We have not published our chromatographic conditions here, and we want to be straight about why.
It is not because they are secret. Separating ferulic acid by reversed-phase chromatography is well-trodden ground and there is nothing exotic in what we are doing. It is because the method is not validated. We have not yet established its precision, its limit of quantitation, its robustness, or whether it resolves the isomers that matter. Publishing conditions in that state invites someone to copy them and get an answer they should not trust.
Principle
When the validation is done, the conditions go up in full — parameters, acceptance criteria, and the data behind them. That is the point of doing this in the open. It is simply not honest to do it a step early.
Why we are publishing this unfinished
Because the honest state of most raw-material knowledge is partially characterised, and pretending otherwise is how the industry got here.
We could have waited, finished the work, and published a clean paragraph saying our ferulic acid is some percentage pure. That paragraph would have been more satisfying and less useful. What we have instead is a method half-built, one unidentified peak, one calibration line that does not sit where it should, and a clear list of what to do next.
That list, for the record: run the gradient to see what we have been missing; identify the early peak from its spectrum; work out why our peak is broader than it should be; extend the calibration and repeat it properly; and buy a reference standard so that next time we can give a real number.
We will publish what comes back, including if it is disappointing.
Nothing here is a claim about any product. It is a record of what we measured on our own raw material, using our own instrument, with the gaps marked as gaps.